

It may not have been the usual variety but there was March Madness a plenty as world markets heaved, lurched and vomited in anticipation, fear and finally the arrival of the coronavirus. With sanity departed and fear ruling the day, anything verging on logical reasoning must be gently proposed in case it gets dismissed into a looney bin of truly unmentionables. Such toxicity – by mere association (even at a safe social distance of 2m or more) would pollute and taint even the tamest reasonable thought.
Political Power Grows from the Tube of a Ventilator
In his search for revolution, Mao was slightly askew in that he identified the barrel of the wrong implement. In a few short weeks across the western world we have shockingly watched the “people” the “Demo” in democracy jump-ship and land right in the middle of “panic” to form “pandemic”. In the meantime, this left the jilted “cracy” to get conveniently hitched up with “auto” in a shot gun wedding.
Next thing you know one third of the world’s population is in some form of lockdown and a gapping Novel-Econovirus-Hole has been blown in world economies, that is so new, that we have little or no data on which estimate its size or scope. The only comment one can realistically make on this is that the last time a crisis caused governments to pump vast amounts of money to fill a hole, it resulted in almost a decade of austerity for most of the global population.
The Emperor’s New PPE (Personal Protective Equipment)
Never before in the history of the world have we had the availability and access to real-time data, never before has an outbreak of disease been churned out in figures, plotted, calculated in such detail with estimates, models, maps, expanding case counts and case fatality rates. Never before has epidemiology been relevant, never mind developing rockstar status. Data (in this case medical) is being treated as a plaything. Just in case anyone needs reminding: data can be dangerous when mishandled and adults should not be allowed to play with data hand-grenades particularly when they are showing signs of pandemic induced insanity. These data hand-grenades blow up.
Comparison of First Quarter S&P 500 Returns and Influenza-Attributed Excess Mortality in Italy
Look at the King! Look at the King! Look at the King! The King! The King! 1 (Spot the difference)
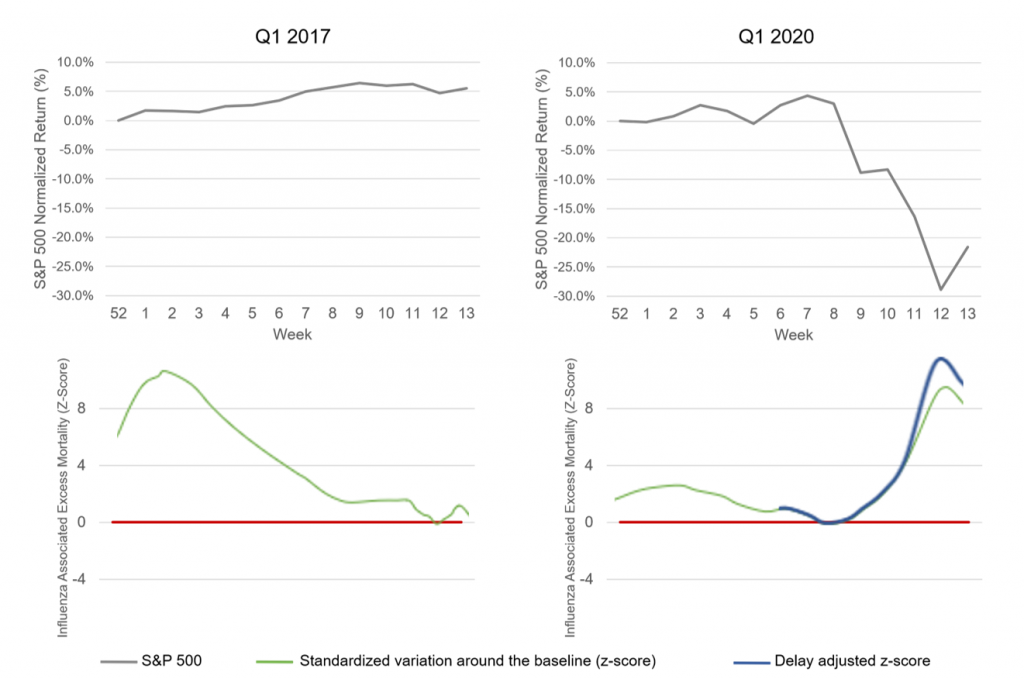
It should be noted that the Influenza-Attributed Excess Mortality as illustrated by the chart for Q1 2017 is estimated to have killed 24,980 – 43,336 people in Italy in the 2016/2017 Flu Season 2 – with no bearing on the S&P 500. Consider the different shape of the 2020 curve (factoring in the increased estimated for delayed reporting of deaths). Look at the S&P 500. The total number of deaths in Italy from Covid-19 was 11,591 3 on March 31st, 2020.
SOURCE: Plotinus Asset Management (Chart), Morningstar and EuroMOMO European monitoring of excess mortality for public health action Week 13 2020 (Data).
Spare a fear (since thought is in short supply) for the approximately 1.15 people 4 who have died from Covid-19 in the 3 minutes taken to read this piece and then a larger fear for the approximately 323.38 people 5 who have died globally in the same period of time. Then think that, the 323.38 is a daily average and think of the degree of impact that same mortality figure had on you yesterday, a week ago, a month ago, 6 months ago, a year ago…
Our human world is not always the sensible rational entity we hope for and assume it to be. Facts are always contextual, and the fact is that currently we are in a world that is afraid, and its markets are naturally reflecting this. As this crisis heals, this fear will subside, and markets will reflect this too and recover. It could help if some plain, dull mathematics was injected into the viral panic now, so that the Novel-Econovirus-Hole – with all of its wildly fluctuating estimates, prognostications, predictions and data – are not similarly mishandled. Investors should be put in a position where they are offered data analysis that enables them to weather volatility, rather than being made subject to it. They likewise will need managers with the ingenuity and new approaches that deal with the times ahead. ■
Volatility of Daily Returns S&P 500TR vs Plotinus 2π Enhanced Index, Q1 2020
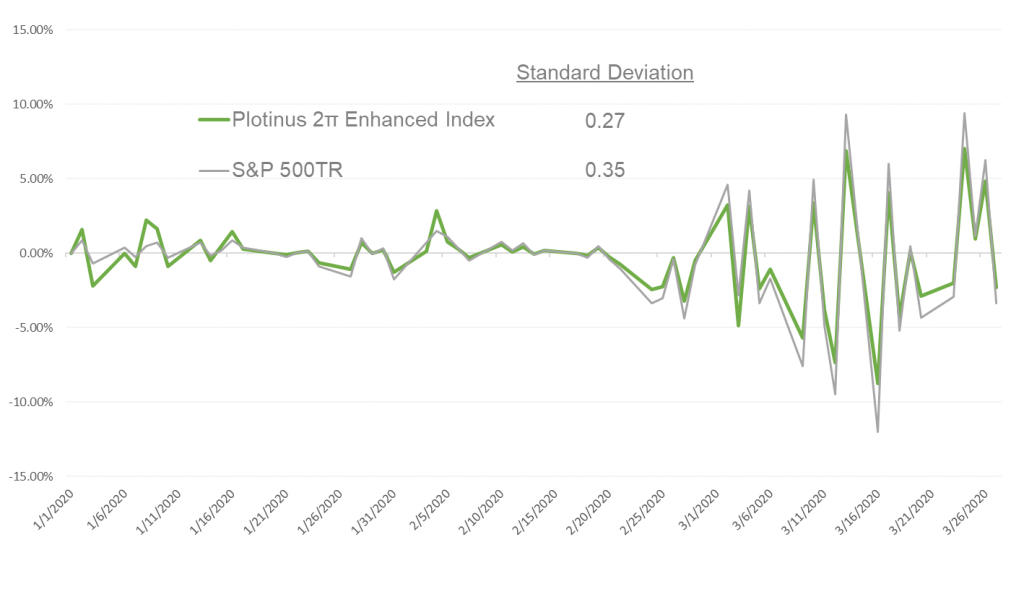
SOURCE: Plotinus Asset Management (Chart), Plotinus Asset Management and Morningstar (Data).
Notes:
© 2020 Plotinus Asset Management LLC. All rights reserved.
Unauthorized use and/or duplication of any material on this site without written permission is prohibited.
Image Credit: MSPhotographics at Can Stock Photo Inc.