

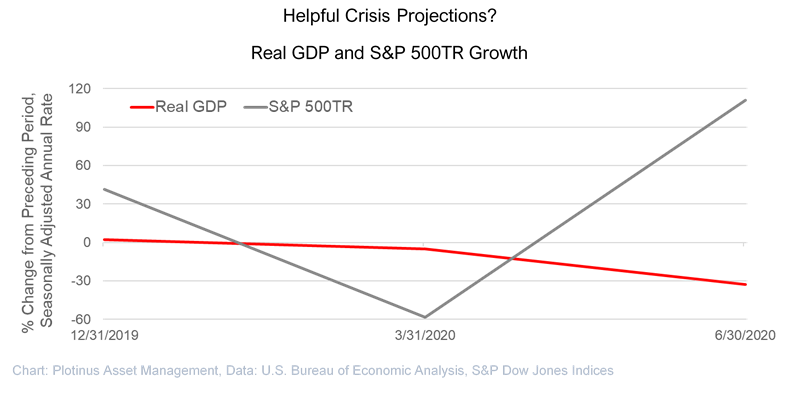
From a US financial perspective, the month of July was a tale of two numbers. The S&P 500TR produced the first month-end positive return of the year at 2.48% and GDP growth figures for the second quarter hit an astounding low of -32.9% annualized. This appears to leave the investor with a deep markets/economy dichotomy.
The question is though, how to contextualize these figures? The abrupt non-functioning of society due to the Covid-19 crisis has to be viewed for what it is, a sudden aberration in normalcy. This is not a reflection of the scale or longevity of that crisis (which remains an unknown), but rather that we are now living in a world where, following one observation (aside from debating with Mr. Taleb the shade of the particular aquatic bird in question), the reality of total global lockdown exists. No one will be as shocked if there were to be another occurrence of it, hence it will become built into the probability of things. In that context, the important word here being “context,” quoting the -32.9% annualized figure is as meaningful or meaningless as the context attributed to it.
| Circumstance | Interpretation |
|---|---|
| Normal | Quarterly real GDP growth quoted in the context of a seasonally adjusted annualized rate projection of how the economy might fare based on the performance of the last measured quarter. This is reasonable, economists in normal conditions tend to be concerned about the future direction of the bigger picture, so quarterly measures and annualized projections make total sense. |
| Abnormal | The abnormality of the situation is recognized for what it is – abnormal. Thus, normal procedures must be viewed within the bounds of the abnormal situation and taken with an appropriate pinch of salt when they clearly are unhelpful. |
The Covid-19 crisis has been a great example of the explosion of data, with people on the pulse of stats and numbers like never before, kindly spurred on by ease-of-access courtesy of technology. An unfortunate downside of ease-of-access, is that it tends to encourage laziness-of-thought. It is shocking to see numbers being quoted in a manner that is bereft of contextual thinking, down to the most basic failure to look at those numbers, for example, on a per capita basis, or to seek meaningful normalizations for comparison, or to avoid extrapolations based on limited data.
As an Artificial Intelligence trader, this is a matter very close to heart, as one is acutely aware of the importance of referencing data in a meaningful manner. If a trader made profits of 1% on $100 two days ago and 2% on $100 yesterday, they have a 100% increase in profits. This is a meaningless, though correct number, in terms of projecting the trader’s future abilities to generate profit.
In a similar vein, one could project an annualized market-return figure of 111% based on the S&P 500TR Q2 return.
Bravo New York Fed
The New York Federal Reserve has responded to the need to provide more meaningful context in the abnormality of the times by publishing since March a previously internal reference figure, the Weekly Economic Index developed by Daniel Lewis, Karel Mertens and James Stock. The New York Fed is clear that the WEI is not an official forecast and explains, “The WEI is an index of ten indicators of real economic activity, scaled to align with the four-quarter GDP growth rate. It represents the common component of series covering consumer behavior, the labor market, and production.” (Lewis, Daniel J., Mertens, Karel, and Stock, James H., Weekly Economic Index). The key here is that whilst not being an official forecast it is an informative aid, which gives GDP growth a more tangible feel in the circumstances.
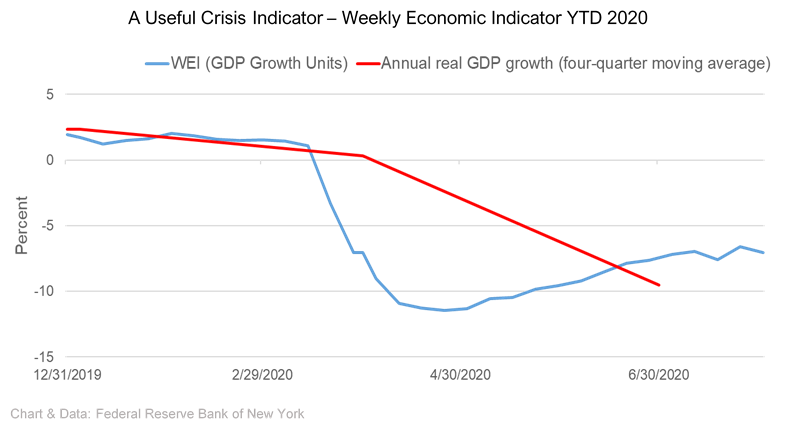
The Weekly Economic Indicator chart illustrates data that can be helpful to investors interested in the underlying movement of the economy in the crisis, in a timely manner. This weekly observation can then be related to other such relevant data, helping to construct a picture of what might be happening in light of the long-term uncertainty, by changing (possibly only temporarily) the viewpoint, to encompass the dramatic economic shock of the Covid-19 crisis. As per the table above, the publication of the WEI recognizes the current context for what it is: abnormal.
© 2020 Plotinus Asset Management LLC. All rights reserved.
Unauthorized use and/or duplication of any material on this site without written permission is prohibited.
Image Credit: Cherezoff at Can Stock Photo Inc.