

The recent acknowledgement by Jerome Powell that the current phase of higher inflation is no longer transitory, is recognition by the Federal Reserve that the present, out of kilter, global supply chain system is going to take time to resolve itself. Thus determining what the prospect of longer-term higher inflation means for the cycle ahead is important from an investor’s perspective.
How can we seek to interpret this? The headlining high inflation figures month-on-month certainly contribute to the ominous atmosphere surrounding it. If though, we try to look beyond the headline, what are the implications of long-term high inflation and do the odd circumstances, the pandemic and its ensuing consequences, question the relevance of looking for prior comparative situations?
If we begin by just looking at the basic figure for October, 6.2%. To find historical comparison one has to go back as far as 1990. Immediately the question is, is such comparison useful? It would be a stretch to find resemblance in the market of 1990 and the market of 2021 nor in the macros of each period either, to any meaningful extent. Would it be valid to consider what is taking place as classic demand-pull inflation, i.e. ignore the pandemic catalyst, and view it simply as consequential to economic growth and supply chain problems?
A Contextual Problem
This issue illustrates a broader data problem. In many circumstances it has become something of a fashionable sound bite to recommend that we, “trust the data” which misses out on the key role that interpretation plays. In answering a complex question, data on its own can be insufficient. Regardless of how sound any data may be, it is the interpretation of that data or more specifically the context in which that data is interpreted that ultimately determines how it answers or fails to answer a given question.
To return to inflation, it is an example of data we can trust, but rather than just looking at it, in and of itself, perhaps it is better to seek different perspectives from which to view the data at hand. Let us look at it within a more defined context – in relation to US Treasury 10 yields for example. The chart illustrates the market yield on 10-year constant maturity US Treasuries indexed to account for inflation and the S&P 500, over almost two decades.
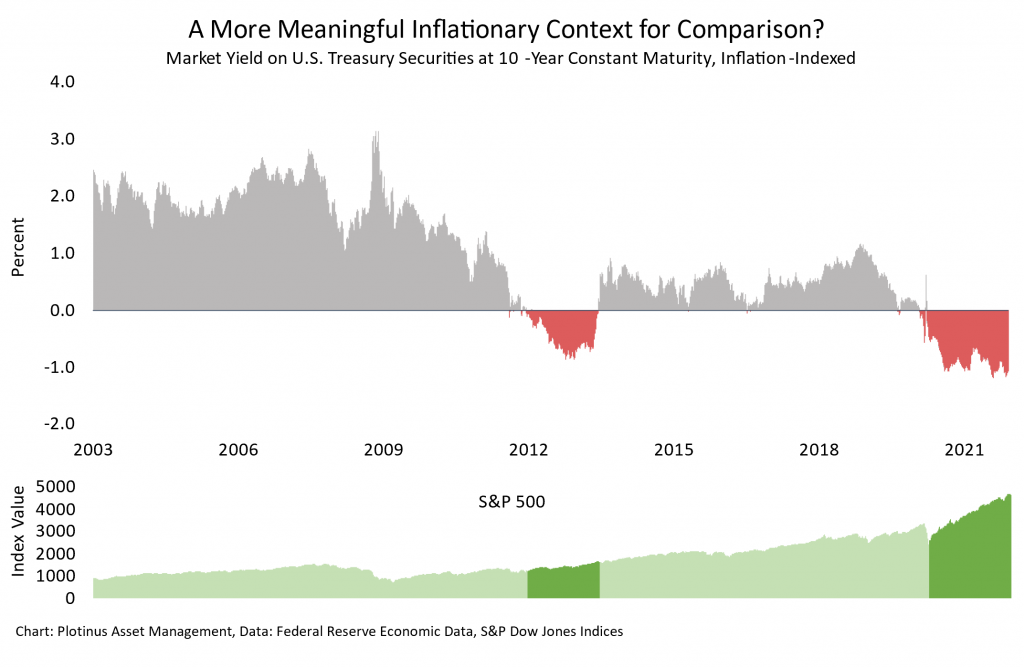
The purpose here is to show how a change of context can potentially provide more meaningful information. The red areas of the chart illustrate that from one inflation-oriented viewpoint, we are currently in a phase for which we have an equivalent, within the last 10 years. Here an interpretation of the inflation data gives us some food for thought which might be a little better than the stale crumbs of a like-for-like comparison with 1990.
Using Technology
This type of situation is where artificial intelligence can possibly step in to offer some extra assistance. AI can help provide fresh contexts under which data can be viewed and interpreted. If properly deployed such an approach can give an edge which is based on information and the ability to extract what is meaningful and actionable from it.
In our firm’s experience using AI trade decision-making, the extent to which it can provide investors with an edge is very much a situation where quality, far outweighs quantity. We have found that the big-data approach of simply amassing and processing vast volumes of data, does not lend itself so well to the nuances of investment management. On the other hand, knowing how to use the power of AI to provide interpretive depth helps us dig below the surface and unearth the real, and in many cases hidden contextual value of data. ■
© 2021 Plotinus Asset Management. All rights reserved.
Unauthorized use and/or duplication of any material on this site without written permission is prohibited.
Image Credit: Maranso at Adobe Stock.