

Just because a data stream is available to use as input in a quantitative model for making trading decisions for an AI-based investment strategy—and it is found to be spiking, whether up or down—does not make it usefully relevant for signaling when and how to trade, be it on an ongoing basis, or even over the short-term.
This is an ongoing challenge for the portfolio manager who is developing or refining an AI-based investment methodology.
For instance, when looking though historical data relating to different factors, coming across some spiking data points is not something that is hard to find. Whether or not any of these have enough statistical relevancy to base trade decisions on is something else entirely.
In the desire to “see” directionality in data on a real-time or near real-time basis that is worth basing investment decisions on, there can be data spikes relating to one specific factor or another that may entice a portfolio manager to, therefore, add that data stream to his or her model used to guide the investment decisions. However, without spending the time to delve into why that data spiking is occurring, quant managers could be erroneously making an investment play based on data that they should have passed on.
This is why, at Plotinus, we believe that in the endeavor for an Artificial Intelligence trading system to establish a statistically vindicated trading decision, there is a constant need to assess the temporal nature of the data inputs. Data for the analytic machine, like food, may look fresh on the outside but be well past its sell-by date. What looks highly relevant at a point, may be just a fleeting observation upon which no sound statistical strategy can be built, and which should, perhaps, in a broader view, be simply ignored. Analyzing potential data inputs for a quantitative AI-driven model to separate pass from play opportunities is easier said than done.
Let us look at three examples that illustrate the need to understand the data that you are looking at.
In this first chart, we show the short-term effect on the market of the release of the consumer-price index data over a twenty-three-year period. Immediately one’s eye is drawn to the dramatically higher levels on the far right of the chart.
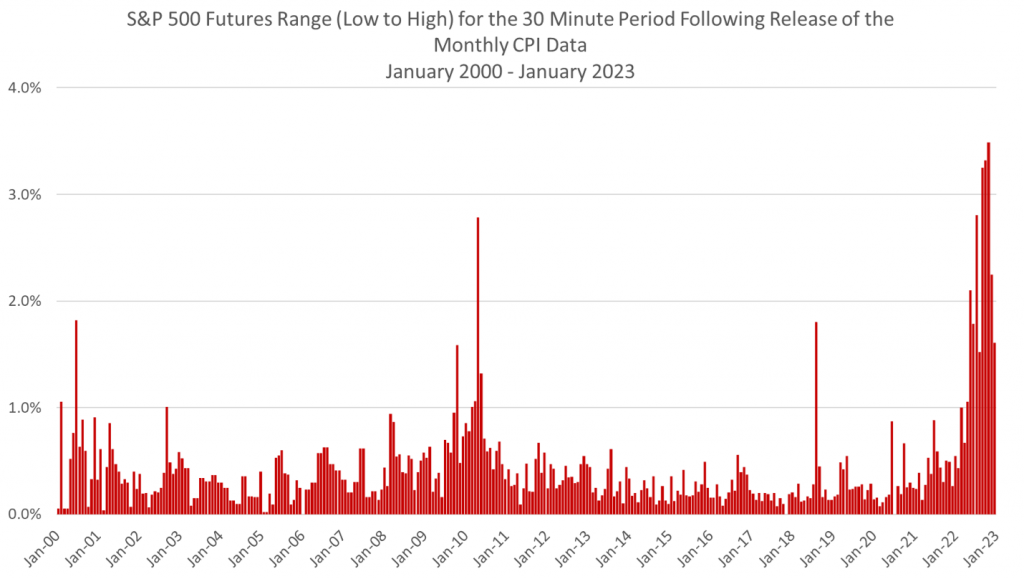
From an announcement’s perspective, 2022 was the year of CPI data. Very understandable given investors’ concerns about the direction of inflation. This is clearly illustrated in the next chart which shows the 10 largest ranges, post the CPI data release, over the twenty-three-year period. Observe the concentration of data from 2022. Seven of the largest 10 occurred in 2022. This is in line, of course, with the inflation figures for 2022, which had the highest levels seen during the period from January 2000 to January 2023.
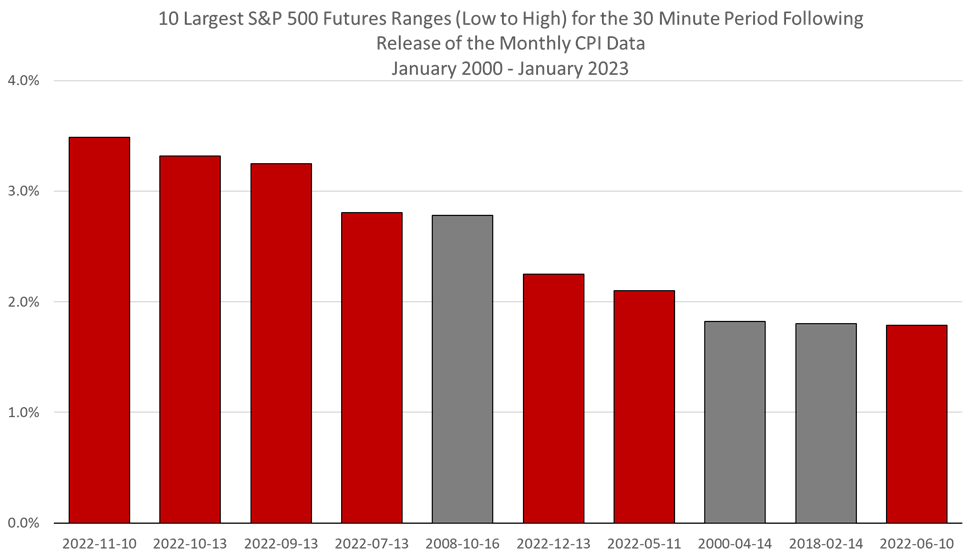
It is also worth noting how abnormal these half-hour ranges are. To give some context, if one were to plot a normal distribution of the ranges of all half-hour trading periods of during these twenty years, where would the highest range of 3.49%, which occurred with the CPI release in November 2022, lie? The answer—16 standard deviations from the mean. We should add the caveat, however: It is not necessarily a good idea to deploy a “normal” distribution when “abnormal” factors have the potential to distort the distribution. In said normal distribution, the 0.3% of all the half-hour trading periods that lie outside of “normal” behavior (greater than 3 standard deviations from the mean) account for a disproportionate amount of the market movement, approximately 4%.
So, what does the significance of the impact of the CPI data announcement on intraday volatility in 2022 look like relative to other factors? The next chart illustrates the 10 largest 30-minute ranges for S&P 500 futures in 2022.
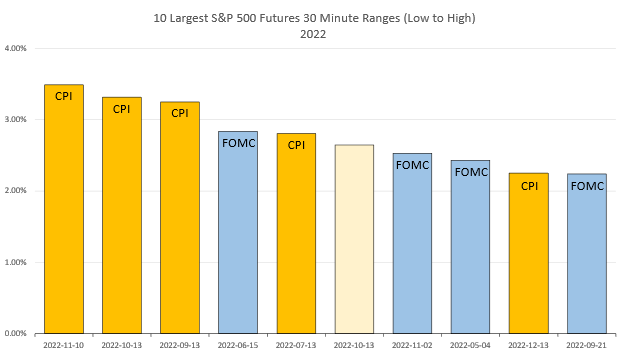
The Federal Reserve’s Open Market Committee meeting is a staple of intraday volatility between the release of the minutes to the Fed Chair’s speech followed by its press conference. It is synonymous with sudden market swings. Once again from the perspective of a 30-minute range, only one of the five largest ranges was ascribed to the FOMC meeting, the other four were CPI data releases. In fact, five of the ten largest were following the CPI data release, four were FOMC-related and the final one was also on a CPI data release day, but later in the morning trading session, not during the 30 minutes immediately after the release.
Understanding What You Actually Observed
So, what does one do with the information in the examples above? Or, more to the point, what should an AI-based investment strategy do with it? Pass or play? This very much depends on the manager behind constructing the AI model used with the strategy and, specifically, the manager’s thought process and decisions as to how what the AI model might observe will be interpreted and acted upon—or not.
For the quant-based portfolio manager whose outlook is to determine tail events and play those outliers, this information is highly relevant. Their deployment of AI will be pointed at seeking out the latent abnormalities, hidden in the assumed normal market behavior.
If, on the other hand, a portfolio manager aims to play the longer game, with a view to weathering these abnormalities, then the AI system that manager uses should be directed at recognizing points that even non-quant, fundamental-based investors acknowledge. First, that the market is rife with abnormal behavior. Second, that an investment strategy, if it is to work over the long-term, has to be robust enough to take some hits and get things wrong, when the data is of the fickle kind.
In practice, that means on occasion not capturing a price appreciation, when the AI passes on or counter-plays an opportunity that the herd has played, and then profited from.
In the view of long-term investors—of which Plotinus counts itself as a member—it is the durable longer-term view that is more important. As more experienced investors recognize, these spiking moments are often the fruit of randomness and there is often a dearth of logic behind them. As such, they can turn from glory to the gutter on a coin toss. Unless the portfolio manager is committed to tail seeking as his or her explicit strategy, and where there is a deep methodology specifically in order to find the spikes, catching them is simply chance.
As we have chosen to adopt the longer-term view at Plotinus, our AI is intentionally designed to use limited derived data as inputs, accepting that in the process we will err on some pass or play trading decisions whenever we find our analytics of such spiking data situations lacking the statistical vindication that we seek (e.g., the separation of more statistically valid trading signals from market noise). It is our belief that over the long run such an AI-based investment strategy can absorb the blows of the occasional “data can be fickle” randomness to achieve a better risk-adjusted stock market return. ■
© 2023 Plotinus Asset Management. All rights reserved.
Unauthorized use and/or duplication of any material on this site without written permission is prohibited.
Image Credit: Mcarrel at Can Stock Photo.