

As investors are finding, there is a distinct lack of consensus on what the latter half of 2023 may bring. Expert opinion on where the S&P 500 will end the year include a pessimistic Morgan Stanley estimate of 3700 and a conservative Goldman Sachs estimate of 4500 (-14% to +3.5% from end-June levels, respectively).
Can the current lower volatility environment be trusted?
The recent volatility context from where these prognostications are made, as illustrated for example by the VIX CBOE volatility index, is one of steadily declining volatility in tandem with the bull market rally during the first half of the year. So why is there such disagreement among forecasters? Are we in the proverbial calm before the storm that a -14% drop would suggest, or in a continued upward climb?
The following chart suggests that it is more likely to be the latter. Like all historical perspectives, we must as always bear in mind that past performance does not necessarily reflect what is to come.
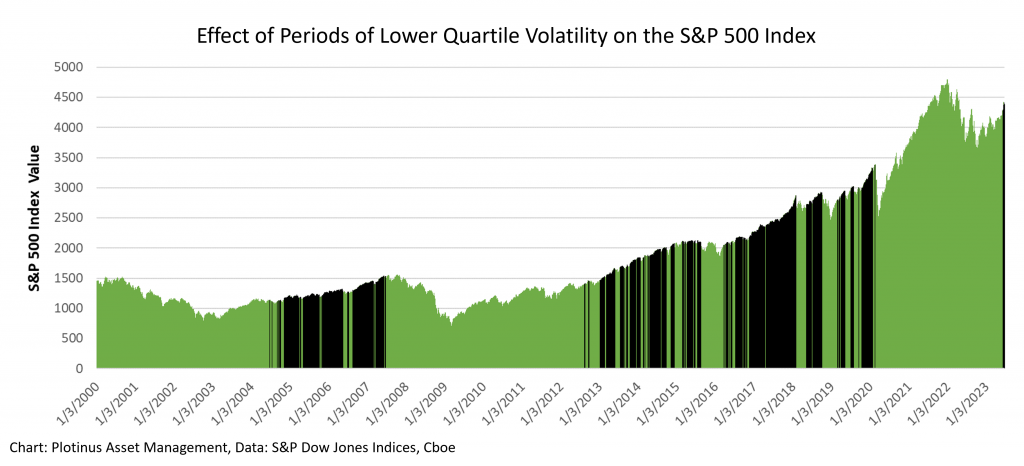
The areas shaded in black show the periods when volatility has been equal to or below the lower quartile value (measured since 2000). The occurrence of these less volatile times coincide, in general, with periods of market growth.
This chart is of course a broad brushstroke view. It does not attempt to provide explanation as to when, how or how violently such low volatility environments may change. A glance at the pandemic aberration in March 2020 is a case in point.
Interestingly, the market recently re-entered this low volatility environment, as can be seen at the far right of the chart. There is, however, insufficient data as yet to determine whether this will be a fleeting phenomenon or the beginning of a new period. Note, however, that there are many more wide black bands in the chart than there are thin ones. This would suggest that lower volatility is more often than not a market phase situation and that the conditions that create it tend to make it somewhat self-perpetuating. Thus, the chart would suggest that perhaps there is cause for continued optimism for US equity investors. ■
© 2023 Plotinus Asset Management. All rights reserved.
Unauthorized use and/or duplication of any material on this site without written permission is prohibited.
Image Credit: Bradcalkins at Can Stock Photo.