

Based on conversations we had recently with a range of sophisticated investors, there seems to be a curiosity as to whether employing AI within an investment strategy could provide their organizations with a truly alternative, alternative investment.
And what would be even more alternative would be if there might be a way to use new, non-traditional Artificial Intelligence tools and modeling in such a way as to achieve, over the long-term, diversification from a core US stock market exposure allocation that delivers risk mitigation and non-correlated alpha, and does so without having to leave the asset class.
As sophisticated investors appreciate, the first reason to diversify is risk mitigation and the second is to generate alternative returns.
The typical path taken by most investors when aiming to diversify a key, core holding in their portfolios—their US stock market exposure—is to reallocate to other asset classes. This has been the typical go-to path followed because traditional equity market focused investment strategies have not been known to be both risk mitigators for that exposure and alternative return generators.
So, let’s take a look at some five-year time frame marketplace data and net returns data from that of our Plotinus Non-Correlated Alpha artificial intelligence-driven investment strategy1 and see what it shows.
Risk Mitigation
Risk mitigation from the perspective of downside capture is a good place to start. Taking the five-year period through August 2023, let us look how our strategy and the rest of the hedge fund indices fared in the months when the S&P 500 had a negative return. In other words, the downside capture, which is the average loss of the S&P 500’s losing months.
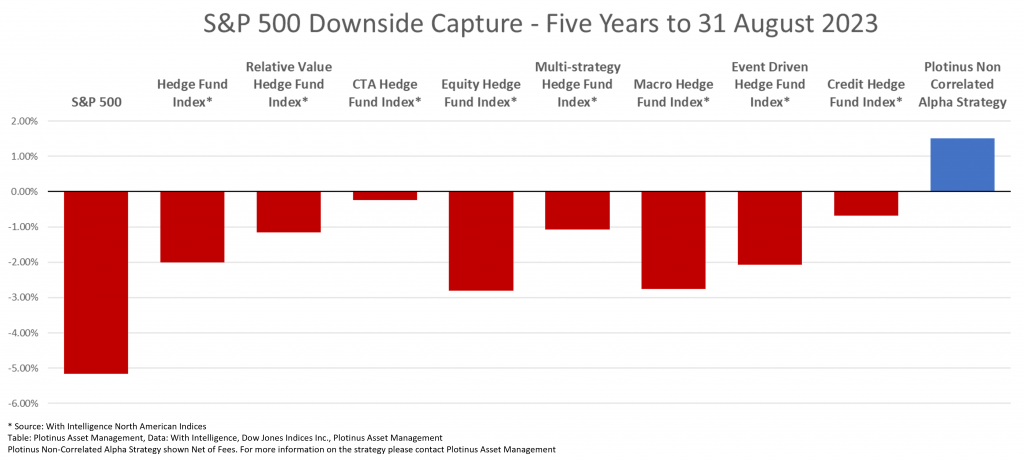
You can see from the chart that our AI-based strategy was the only one among its peers to provide positive protection rather than just ameliorated losses as compared to the S&P 500. So how would this translate when used in combination with an S&P 500 investment?
What Would a 90/10 Portfolio Show?
One typical way many investors start testing to see whether modifying something in their investment mix can begin to move the needle toward the desired new set of characteristics is to see what a ten percent allocation to the new strategy might reveal.
For illustrative purposes, let’s assume that an investor wishes to diversify a 100% US stock market exposure as represented by the S&P 500 Total Return into a 90% S&P 500TR and a 10% allocation to a US market focused hedge fund.
What impact would the selection of traditional hedge fund strategies and the AI-driven Plotinus Non-Correlated Alpha strategy have comparatively on overall performance were they to comparatively represent a 10% allocation in combination with a 90% S&P 500TR allocation?
As the first chart shows, over the recent five-year period, only two combinations provided better annualized returns than the S&P 500TR’s +11.12%: the Macro Hedge Fund Index, which returned +11.21%, and the Plotinus Non-Correlated Alpha which delivered +12.54%.
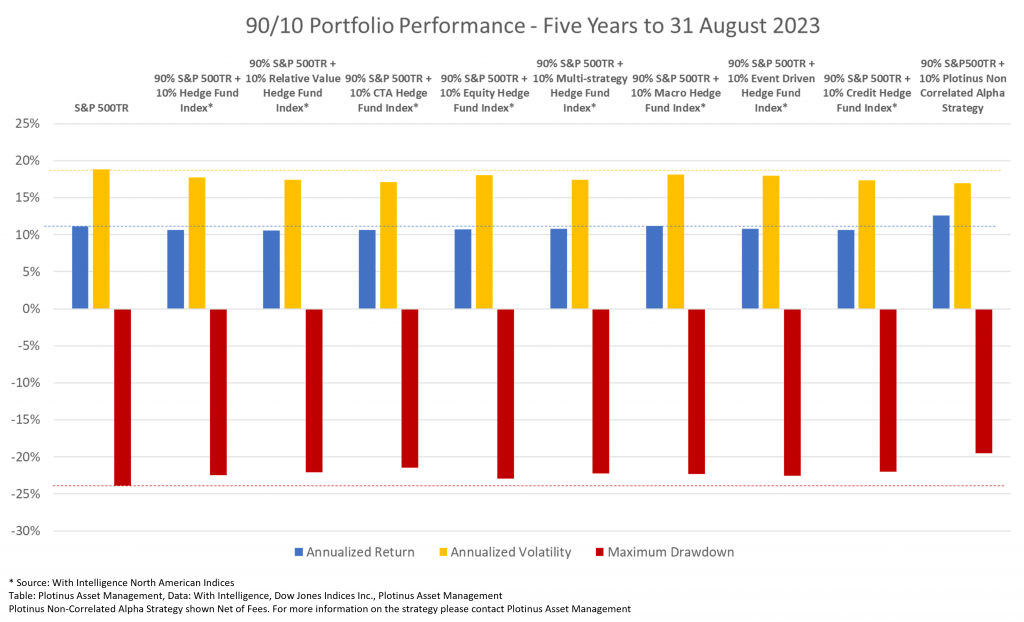
In terms of volatility, the addition of any of the hedge fund strategies reduced volatility compared to the S&P 500TR, which had an annualized volatility of 18.79%. However, once again, the Plotinus Non-Correlated Alpha AI-based strategy had the greatest impact reducing the volatility to 16.98%, while the second most impactful diversifier was the CTA Hedge Fund Index, which reduced it to 17.07%.
Finally with this chart, is the strategy effect on the Maximum Drawdown. Once again, as one would expect, all of the 90/10 portfolios reduced the maximum drawdown. The S&P 500TR had a max drawdown of -23.87%. The most significant reduction is easily seen from the chart, the Plotinus Non-Correlated Alpha strategy with -19.54%, followed by the CTA Hedge Fund Index, some way behind at -21.46%.
Beta Value Than the Alternatives?
The intriguing facet of the Plotinus Non-Correlated Alpha strategy is that it does not require an investor to reduce exposure to the US stock market—rather it keeps the allocation there but manages to generate its return in a different way.
Perhaps the most striking performance metric from this 90/10 experiment is the Beta value, the degree to which the return is dependent on the movement of the market. Once more, the lowest Beta value is that of the Plotinus Non-Correlated Alpha at 0.90, with the CTA Hedge Fund Index next lowest at 0.91.
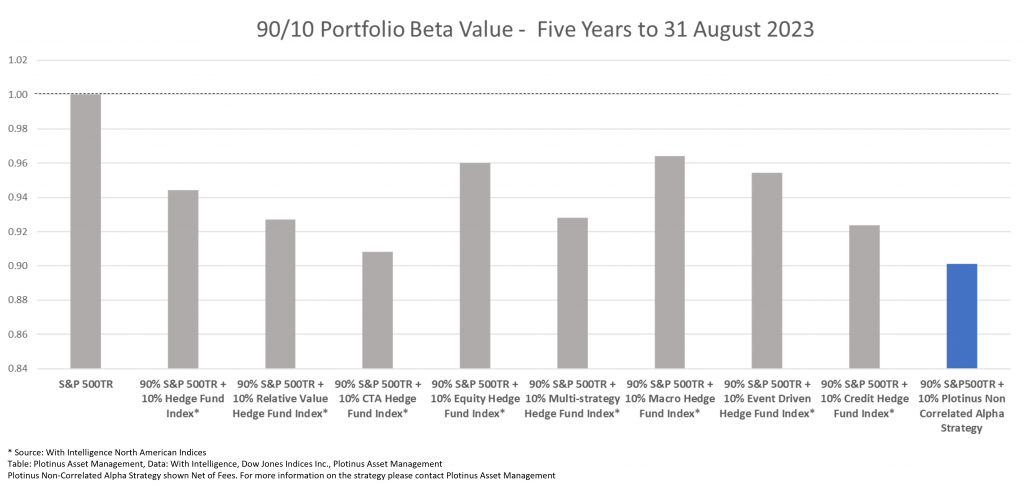
The CTA Hedge Fund Index of course has a different (and, it so happens, lower) Beta, as the movement of a basket of a broad range commodity futures does not, historically, mimic or match the Beta of the S&P 500.
The Plotinus Non-Correlated Alpha strategy, on the other hand, exclusively trades the S&P 500 Emini Future. So, one could almost expect a higher beta from such a strategy as compared to the rest of the hedge fund indices. The fact that this is not the case should give investors pause (in a good way, we hope).
Our AI-driven investment strategy has shown the potential to access active alpha generating opportunities from within the movement of the S&P 500 that are clearly different than those gained from direct exposure to the S&P 500’s passive return.
This may have some forward-thinking asset allocators rethinking the options they have for adding diversification, risk mitigation, and non-correlated alpha generation to their portfolios. ■
1 For further detail on the Plotinus Non-Correlated Alpha Strategy please contact Plotinus Asset Management.
© 2023 Plotinus Asset Management. All rights reserved.
Unauthorized use and/or duplication of any material on this site without written permission is prohibited.
Image Credit: Twindesigner at Can Stock Photo.