

The recent flaring of tensions in the Middle East, with the escalation to the exchange of direct strikes between Iran and Israel, has provoked the general awareness of geopolitical uncertainty and its potential impact on global markets. This creates an occasion therefore, perhaps, to reflect on the effect of shock-factors on stock markets and the general difficulty when grappling with the analysis of the unexpected.
Let us begin with the current threatening uncertainty, a potential direct Israel/Iran conflict. Analysis of geopolitical events that traumatized US stock markets frequently include the Yom-Kippur War/Arab Oil Embargo in 1973 and the Iranian revolution in 1979 as two such events, so one could argue that given the actors involved there is a historical precedence for worrying about the potential impact of a conflict on the US economy. Whether or not such an historical view has relevance to our contemporary situation is highly questionable given, for example, the changes to global oil supply in the intervening half-century. Furthermore, it is worth noting that market turmoil due to geopolitical shock-factors is significantly rarer when compared to its economic equivalent.
No patterns — Just observations
For the purpose of exploring this in a US context, we will choose to look at the S&P 500 daily returns from 1980. Unusual events are sometimes described as tail events, as in they appear in the extremities (the tails) of the distribution curve. The chart below illustrates the distribution curve of S&P 500 daily returns from 1980–2023.
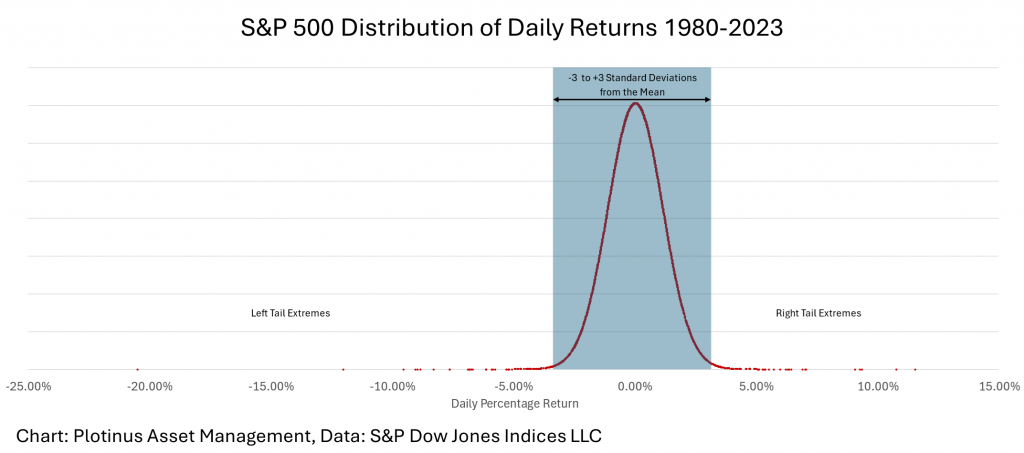
For our purpose we consider an unusual event as anything beyond three standard deviations from the mean, a +3 sigma event. Were the distribution of the daily returns a normal distribution, we would expect a +3 sigma event to occur on average 0.3% of the time or 3 times out of 1000. In the context of these daily returns, a +3 Sigma event equates with a daily return of +/- 3.29% and we should, in theory, expect three such events every four years (there being approximately 250 trading days/year).
As can be seen from the chart, the S&P 500’s distribution is far from being normal. There are slightly over 11,000 daily returns giving an expected incidence of 33.3 unusual events, however, as can be seen by the density of the tails, both positive unusual events and negative events, there are many, many more. In fact there are 162 incidents or nearly five times more than would be expected were the distribution to exhibit normal behavior.
The next observation to be made is the tendency for there to be a clumping of extremities. The next chart shows the number of extremities in each of the 25 years where at least one occurs across the 43-year period from 1980–2023.
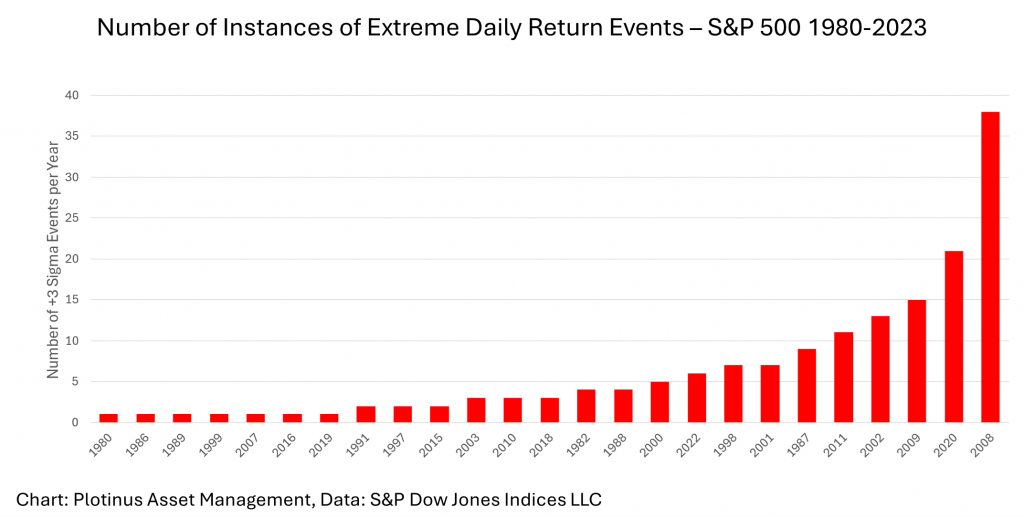
Unsurprisingly the financial crisis of 2008/2009 has the most instances. 2008 has the most with 38 and 15 in 2009. The other outstanding year is 2020 at 21, again understandable, in the anomalousness of the medico-shutdown of the global economic system.
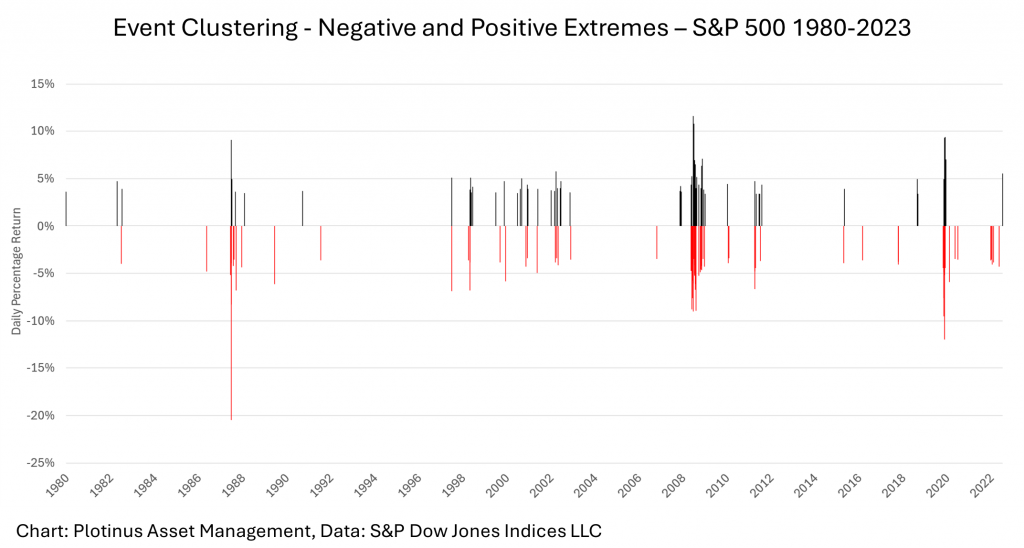
Another feature is that these multiple instances have swinging instances of negative and positive tail events, this of course has a logic of sorts, in that these market traumas reflect the market’s volatile uncertainty which is then reflected in several ‘knee-jerk’ over corrections in each direction.
It is important to stress that these are all post-event observations and therefore they do not provide helpful patterns to determine or predict the next tail event crisis other than indicating that more are of course likely to happen. When they do, it will inevitably have the element of surprise, which latterly many of those caught off guard will claim to have seen coming. Thus, the only conclusion, if there is one, is that tail risk, is very real and portfolios should be built in such a way to attempt to mitigate its most negative effects.
Managing Tail-Risk in an Artificial-Intelligence Context
From Plotinus’ perspective, we look at what artificial-intelligence approaches bring to the tail risk-problem. Our impression is that rather than ‘chasing the tail’ by incorrectly assuming there are unseen patterns out there that will call the next crisis, AI’s best contribution to tail risk is quite simple, better short-term directional signal quality. Interestingly this signal quality should not be confused with signal accuracy.
There can be something of a näive over-focusing on the accuracy when AI approaches are being discussed, which distracts from the reality that it is the magnitude of the correctness of the trades that matters, not the number called correctly. This is the lesson of an awareness of tail-events which are the make-or-break moments that are burned into the collective trader-memory by events such as October 1987. Hence an AI trade decision-making system must be sufficiently cognizant of the reality of the shape of the distribution of returns and how that must influence its trading decisions. ■
© 2024 Plotinus Asset Management. All rights reserved.
Unauthorized use and/or duplication of any material on this site without written permission is prohibited.
Image Credit: Marekuliasz at Shutterstock.