

The term “Data Science” can convey a certain glow of empirical purity, distilling understanding from observed facts. This is in many cases, unfortunately not the case. “Data Alchemy” on the other hand would sound much less convincing and would imply that those involved in such wizardry were potentially cooking up their results. The reality of data science though is that even when rigorous scientific analytic methods are applied to data, the data itself for the much part is much more subjective than it is assumed to be — not the objective recording of information one might initially think. From an investment perspective this issue poses a problem for all data-based decisions for the sophisticated investor.
The Angle of Observation — Different Ways of Viewing the Same Information
To explore this issue, let us look at the topic of environmentally-focused ESG investing. The premise for this type of investment is that there is money to be made in long-term environmentally-sustainable investments. That is, investment in growth sectors which are centered on the mitigation of the impact of human-induced climate change. The flow-of-funds towards these sorts of investments in recent years is significant, take for example iShares ESGU ETF which currently has net assets of $12.7 Bn. 1
If we look specifically at human-induced temperature rise, the United Nations IPCC (Intergovernmental Panel on Climate Change) data is shown in Chart 1.
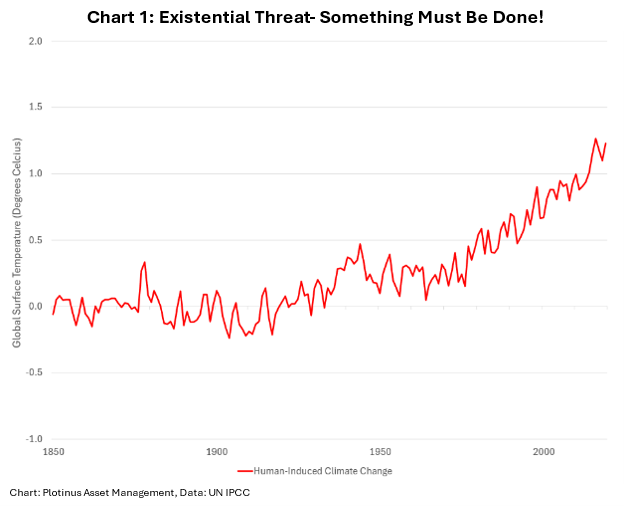
In some sense this chart says it all: human-made devastation is in need of mitigation unless we wish that upward trend to continue unchecked towards existential doom. This is a conclusive data-based argument for why environmentally-focused investing is a good decision. Action needs to be taken; thus, the area is ripe for growth and by extension profit — and ESG brownie points too — if that is what the investor is seeking.
On further reflection though, is that a little too simplistic? Since we are looking at something human-induced it is appropriate to consider the most significant change that has occurred over the period of the data shown in Chart 1. Humanity has not been static. Since 1850 the population of the world has increased more than six-fold, from 1.26 Bn people to 8 Bn.
So, let us look at the same data as before, but from a per capita perspective, to include the relativity conveyed by the expanding global population.
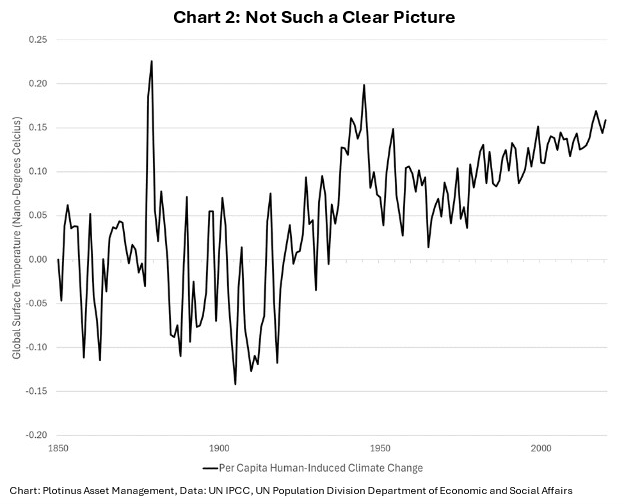
As can be seen from Chart 2 it is a significantly different picture than Chart 1. This is an example of the subjectivity of data, due to a minor alteration, from an absolute to a relative assessment. Both charts allow for very different deductions to be made.
Chart 1 illustrates the increasing environmental damage caused by humanity in terms of human-induced temperature increase. Chart 2 illustrates how fluctuating this human-induced temperature increase is on a per capita basis. In a way, this is much more difficult to interpret. For example, an increase can be observed in the last 50 years, yet it is at lower levels than it was in the 1940s.
It’s the Population Stupid!
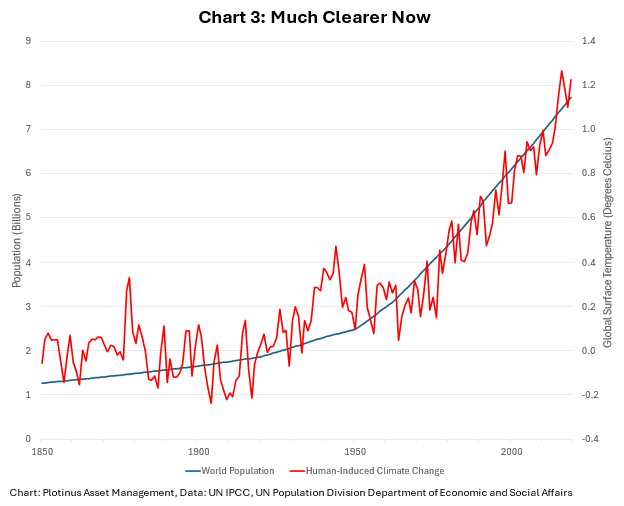
One could be forgiven for thinking that considering the variation of human activity in the industrial age, and all the accompanying technological developments and its increasing resource consumption since 1850, we should be able to see a clear link between our per-capita contribution to human-induced temperature increase, but instead it is mild and varied. However, if we look at the most basic of observed changes — increased population the link is clear to see — there are more of us humans, many, many more of us, hence our contribution collectively to increasing temperature is proportionate to our number. This is shown in Chart 3.
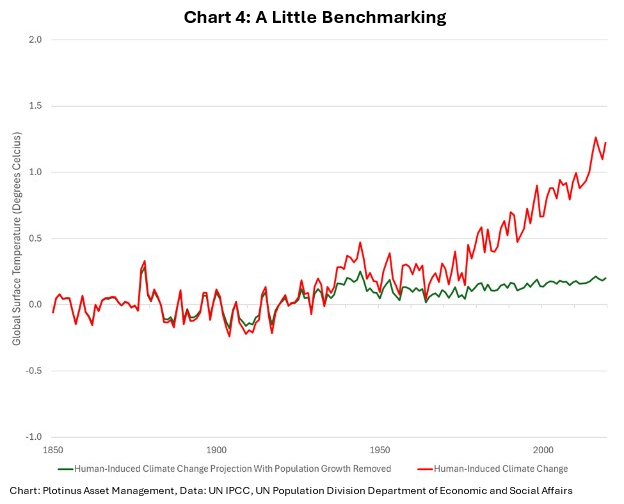
To emphasize the relevance of this observation, let us look at the effect of correcting for population increase (by holding the 1850 population figure static).
The End May Not be Nigh
World population growth is slowing, in fact the growth rate peaked in 1962-63. According to United Nations estimates the global population is expected to reach a maximum of 10.43 BN in 2085 and gradually start falling thereafter. Given the relationship observed between the increase in population and global surface temperatures, it would suggest that this future population projection could act as a relatively accurate yardstick for estimating future human-induced temperature increase. A forecast based on taking the current per capita level of human-induced temperature increase multiplied by the projected world population is shown in Chart 5.
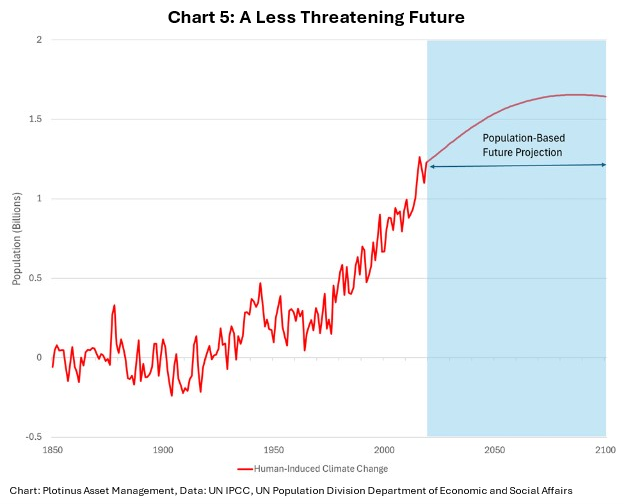
Surprisingly the highest point reached using this forecasting method is 1.65°C not much beyond the Paris COP21 Climate Goal Target of 1.5°C and that assumes no mitigation measures beyond what is already being done. It is very much lower than the scary worse case scenarios of some climate modeling.
It is necessary to be aware of the limitations of such rudimentary modelling and to keep an open mind to extenuating complex factors that it explicitly makes no effort to include. Like, for instance, what would happen if the entire world population became equally wealthy? In other words, more people with the economic power to consume more resources. On the other hand, how useful is an overly complex model that stretches to factor in societal utopia?
History Repeating Itself
It is ironic that the very population data we are using to explore the effects of altering the angle of observation of climate data, was once itself a thing to be feared. In the 1960s there was genuine fear that the world’s population could not be sustained above 6 billion people. Yet here we are, living in that future, with a population of 8 billion. We can concur that humans have something of a tendency to be apocalyptic in their future projections – something that the more risk averse investor might relate to!
What’s In It for the Investor
The purpose of these illustrations is not to explore climate science, it is to prod the investors’ mind to think beyond the immediately obvious. No investor would fail to appreciate the difference between relative and absolute values of stock prices, everyone knows the difference between a ten-point increase in the S&P 500 when the index was valued at 1000 and the same points increase when it is valued at 5500. When though presented with different, perhaps more unfamiliar, and potentially more complex data, it is essential to apply the same rigor in attempting to understand the implications of relativity and how that can alter the manner in which the data is viewed and how this can in turn be used to help make better more informed investment decisions.
So, with regard to environmentally-focused ESG investing, our takeaway is to analyze the data from as many perspectives as possible keeping in mind that the most critical perspective is one’s own investment horizon. Know the trees from the forest. Humanity has a short collective memory when it comes to theoretical mistakes, let’s not forget after all, that we are living in a world currently, that should not have existed, based on fearful over-population projections of yesteryear. Investors in this field who can remain real and grounded in their future projections and assessments can look forward to a plethora of shorting and arbitrage opportunities. ■
© 2024 Plotinus Asset Management. All rights reserved.
Unauthorized use and/or duplication of any material on this site without written permission is prohibited.
1 iShares ESGU ETF as of July 26, 2024 has an of $12,685,443,171.
Image Credit: Guenter_Albers at Shutterstock.