

October has not failed to live up to its reputation as a volatile month for the US stock market. For those seeking an explanation, the fall is being blamed on the rise of US 10-year treasury yields, which crossed 5% for the first time since July 2007. With risk-free investment around 5%, the shine is somewhat taken off risky US equity investments. In addition, the prospect of higher-for-longer borrowing costs does not bode well for US companies and by extension the stock market.
Whilst the “first time since 2007” might be a neat media soundbite—and we all know what followed July 2007…—is the comparative reference to something more than 16 years ago really that comparable? Even a very basic attempt to relativize now to July 2007, such as inflation adjustment, leaves a question mark. The inflation adjusted 10-year yield in July 2007 was 2.5% whereas the same adjustment for now is 1.3%. In other words, in July 2007 an investment in the 10-year treasury was almost twice as attractive as it is now. Whether a flight from equity to freshly minted treasury for such a relatively low adjusted yield is a sign of profound market weakness or just the allure of the unadjusted return, we leave the reader to form their own opinion, rather than offer a prognostication of our own.
Regardless of how attractive newer issues may be, the reality for many US (and international) investors is that they have a much broader exposure to the US bond market. Hence, they are more likely to be experiencing the effects of the bond market rout rather than the joys of 5% risk-free. If we look at the largest US bond ETF by AUM—the iShares Core US Aggregate Bond ETF: Ticker AGG which is based on the Bloomberg Barclays US Aggregate Bond index—it is down -2.29% YTD.
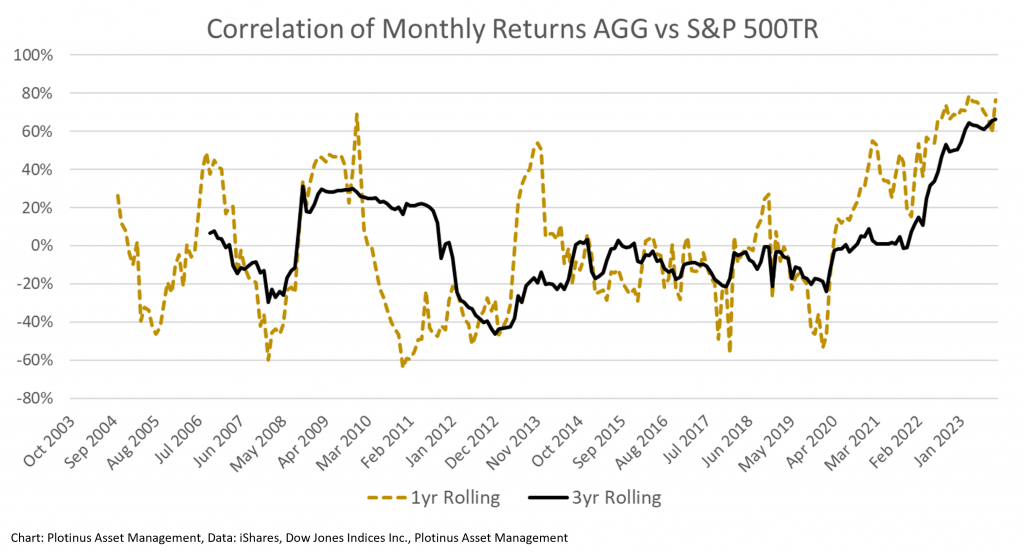
Let us look at the correlation of monthly returns of the AGG vs the S&P 500TR. In order to demonstrate this, we have chosen to plot a rolling one-year and three-year correlation using data from the AGG’s inception, which was at the beginning of October 2003. As an aside, in reference to our previous discussion of the problems of directly comparing July 2007 and now, look at the differences for the two correlation figures between then and now.
The Traditional Downside Capture Argument
So, if bonds are developing an ever-increasing correlation to US equities, what of the effect on downside capture? The following chart answers that question.
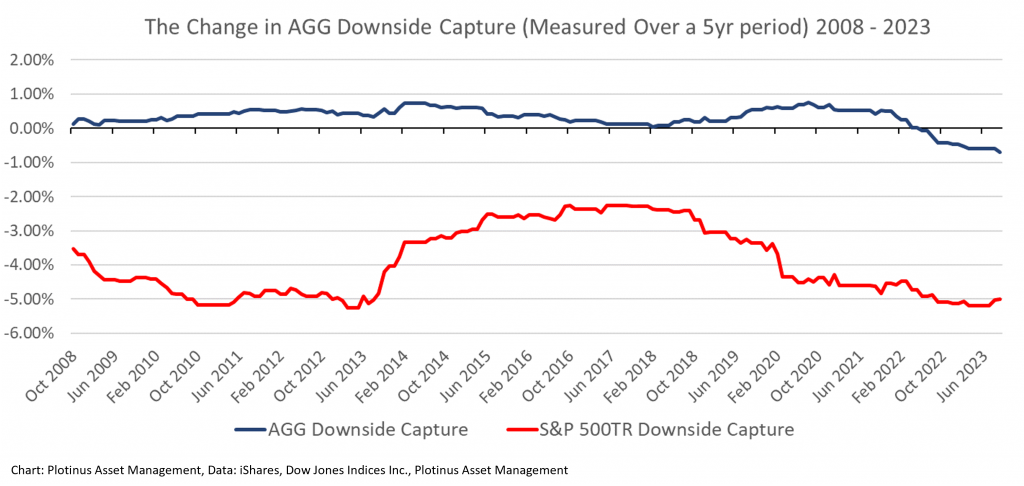
It is easy to also observe the declining downside capture of the AGG, which in this case is measured over a five-year period. Thus, it would appear that the downside capture argument of a bond investment requires serious revision if it continues to yin when it should yang.
Addressing the Dilemmas of Now in a Different Way
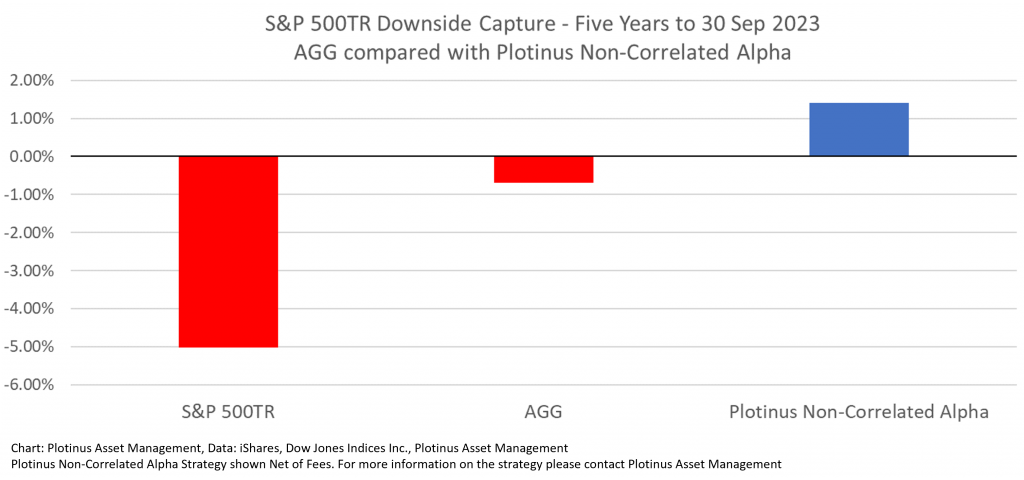
The next chart lets us see how this downside capture looks over the most recent five years compared to our own Plotinus Non-Correlated Alpha strategy, which you may recall we reviewed in our commentary last month (AI Insights, September 2023) versus other alternative investments.
Present times require new approaches, in keeping with the contemporary moment, not tired old ideas that come under scrutiny with the test of time. AI-driven trade decision-making strategies present a new tool, one that can be usefully applied to construct robust investment portfolios that have the potential to address the dilemmas of now that sophisticated investors currently face. ■
© 2023 Plotinus Asset Management. All rights reserved.
Unauthorized use and/or duplication of any material on this site without written permission is prohibited.
Image Credit: Twindesigner at Can Stock Photo.